The Dual Challenge of High-Dimensional Data
Clustering promises to find hidden patterns, but two major barriers stand in the way.
The Curse of Dimensionality
As features increase, data becomes sparse. Distances lose meaning, and traditional algorithms fail to find clear structures. The patterns get lost in the noise.
The "Black Box" Cluster
Even when clusters are found, they're just labels like "Cluster 0." What defines this group? Why do its members belong together? The reasoning is a complete mystery.
The Solution: A 4-Stage Pipeline
An automated workflow that transforms raw data into understandable insights.
Configuration
Point the pipeline to any dataset with a simple config file. No code changes needed.
Preprocessing
Automatically handles missing values, scales numbers, and encodes categories.
Core Analysis
Reduces dimensions with UMAP/t-SNE and finds optimal clusters with k-means.
Interpretation
The magic step. Generates a multi-faceted report explaining *why* the clusters exist.
Live Demo: The Titanic Dataset
See how the pipeline automatically rediscovers the historical reality of the disaster from raw passenger data.
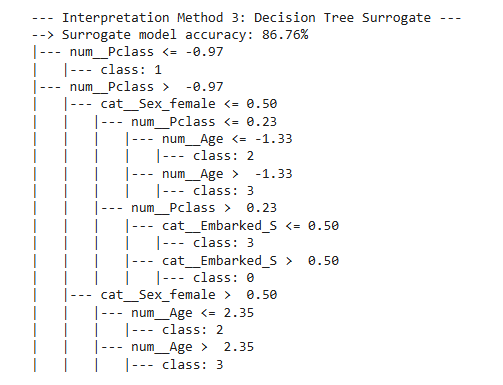
Pipeline Output: Explaining the Clusters
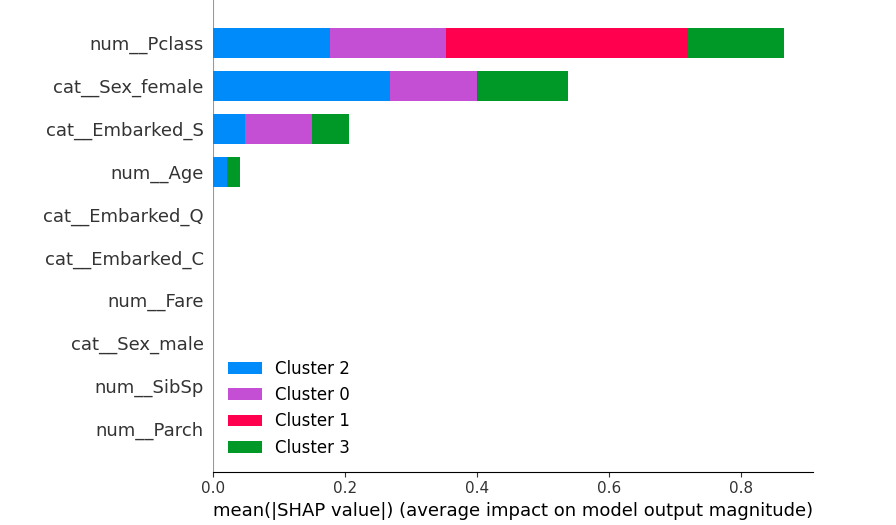
Top Drivers of Separation
SHAP analysis reveals the most influential features in forming the clusters. Passenger Class and Sex are the dominant factors.
- 1 Passenger Class (num_Pclass)
- 2 Sex (cat_Sex_female)
- 3 Port of Embarkation (cat_Embarked_S)
Validated on Diverse & Complex Datasets
The pipeline's robustness was proven on a wide range of real-world data.
Bioinformatics
(>20k Features)
Ecology
(>580k Samples)
Image Rec.
(70k Images)
Social Science
(PISA 2018)